
By Steve Alder, CEO, Telefonica Dynamic Insights (@dynamicinsights)
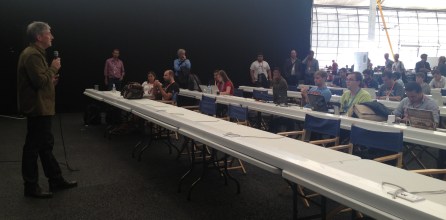
15 September 2013: In the midst all the usual debates, workshops, innovation and entertainment, this year’s Campus Party featured something a little bit special. Launching at the 24-hour technology festival was the Datathon for Social Good.
Created by Telefónica with support from The Open Data Institute (ODI) and MIT, the Datathon was a way for Campus Party attendees to utilise open data to build concepts, applications and even entire businesses, all with the ambition of improving the way we live.
The Datathon launch was hosted by our Big Data arm Telefonica Dynamic Insights, Professor Alex ‘Sandy’ Pentland from the MIT MediaLab (see him in action in this video) and Gavin Starks, CEO of The ODI.
Over four days, they worked with different teams to discover how we can use the huge amounts of information generated by everyone today to help create significant social impact.
Judging the final entries from the 12 teams was a seasoned panel of experts including: Chris Parsons, VP Head of Innovation and Partnerships, Dynamic Insights (@dynamicinsights); Neil Crockett, CEO, Connected Digital Economy Catapult (@ncrockettcdec); Dave Tarrant, ODI Open Data expert (@ukodi); and Andrew Grill, Kred CEO (@andrewgrill).
The competition was fierce and every team pushed the boundaries of what has previously been achieved with such big open datasets. The result was a torrent of interesting and genuinely innovative ideas, some theoretical, some practical. My top three?
– A route selection app that allows users to choose the cheapest, quickest or most environmentally friendly route to their final destination. Watch the video here or below
[youtube]http://www.youtube.com/watch?v=Ou8xthrLwiI[/youtube]
– A tool to understand how to visualize demographic changes in London according to weather and time of day. Video here or below
[youtube]http://www.youtube.com/watch?v=ePxQpeO9JXs[/youtube]
– A crime prediction model that can be used to plan emergency services.
Overall the standard of the competition and the quality of developed projects was incredibly impressive. What stood out to all involved, however, were the clear benefits of a data-driven economy.
The work has only just started to truly harness the power of open data to make the world a better place.
![[Guest Post] It’s the attack of the disruptors](https://en.blogthinkbig.com/wp-content/uploads/sites/5/2014/08/shutterstock_141206683.jpg?resize=p%2Co)
![[Radar7] Digital music models, Nintendo and megacities](https://en.blogthinkbig.com/wp-content/uploads/sites/5/2014/01/Light-dance_final-bk_1200px_W.jpg?resize=p%2Co)