
Natural disasters affect millions of people every year and can potentially cause major disruption in infrastructures which in turn affects the efficiency of emergency responses. In this context, the availability of accurate information to understand where is the population, how is moving and how is behaving is critical to identify key areas where to focus the response.
Cell phones have become a pervasive technology worldwide and as such can be considered as the main sensor of human behavior. The information generated by a cell phone when connected to its telecommunication network can be used during a major natural disaster as a data source to identify concentration of populations, mobility between areas or social networks that are forming. Cell phones provide an efficient and almost real-time tool to evaluate the impact of the public policies put in action to relieve the population during the emergency. Not only that, but by simulating different environments it also provides results on what other policies could have been potentially more effective.
Realizing the potential of such information to help emergency responses, in Telefonica I+D we have been working in a variety of applications that use the data provided by a cell phone network to demonstrate how this information can be used to learn lessons and plan for emergency responses during natural disasters. We have focused our study in three main areas: Modeling mobility and the spread of viruses, which we applied for example to the H1N1 outbreak in Mexico in 2009; characterizing the mobility of individuals affected by flooding, as we did for the severe flooding of the Mexican Caribbean coast in 2014; and studying the behavior of individuals during earthquakes, as we did for the Oaxaca earthquake of 2011. The three studies use aggregated and anonymized cell phone data collected during the time of the natural disaster.
In 2009, a first case of flu pandemic (H1N1 virus) was detected in Mexico. The virus spread to the whole country and after that to the whole world. In an attempt to contain the spread of the virus, the Mexican government took various actions, following the recommendations of the World Health Organization (WHO), aimed at limiting the movement of its citizens. These included the forced closures of public spaces such as airports and universities.
We focused the study in one of the cities that had more affected cases. The first step was to measure the number of visitors to critical infrastructures during the implementation of measures to limit mobility and compare that number to a baseline. Our results indicated that at the university campus, call activity levels dropped significantly indicating that students and professors followed the advice. Nevertheless the airport (presented in Figure 1) received twice as many visitor when compared to the pre-flu baseline, suggesting that government advice was not followed, potentially due to people attempting to leave the region before the total closure of all non-essential activities was imposed. As a result the objective of containing the spread of the virus was somewhat limited due to high mobility of individuals in airports during the time previous to its closure. We also studied the number of visitors to hospitals and did not detect any change when compared to the pre-flu crisis.
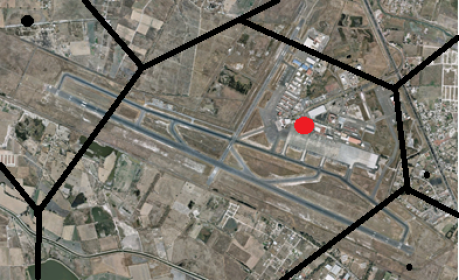
Figure 1. Airport focus of this study, showing the towers and their area of coverage. In red is the communication tower that gives coverage to the airport that was used to count traffic of people during the outbreak.
More interestingly, by using virus spread models combined with agent systems, we were able to replicate the evolution and the spreading of the disease. The simulations revealed that the government’s intervention reduced population mobility by an estimated 30%, while the peak of the epidemic was postponed by almost two days and the number of infections dropped by 10%. These results underline the value of evaluating hypothetical scenarios and public policies using big data. You can see further details of these studies in references [1] and [2].
Although such outbreaks are not frequent at a world level, since this study there have been other situations, like Ebola in West Africa and Zica virus in South America, where such approach could have help governments during the emergency situation.
Severe flooding causes major disruptions as individual have to abandon their residence and are evacuated towards safer zones. As a result large areas remain abandoned until the population comes back and in general governmental organizations do not have a clear idea of the number of individuals that are evacuated and to which areas they are evacuated. Considering this scenario we studied the evacuation process during the Tabasco floods of 2009. Mobile phone activity data was combined with remote sensing data (satellite images), rainfall data, census and civil protection data to understand how people communicated and moved in order to explore ways that mobile data can be used to improve disaster response. Figure 2 presents the area under study. The results of the study showed that the patterns of mobile phone activity in affected locations during and after the floods could be used as indicators of flooding impact on infrastructure and population. Figure 3 presents the main mobility routes during the flooding in the affected area.
The study found that 70% of individuals evacuated remain close to their original location and moved 10km or less, that 27% where evacuated outside their original location, moving more that 10km but less than 100km, and that 3% of individuals were evacuated to areas located more than 100km away of their original location. The information of how long does it take to those individuals to come back is very relevant as it is an indication of how long does it take to get back to normality and to recover the economical pulse of the area. In that sense 65% of individuals came back in less than 7 days , 25% took more than 1 week and less than one month, 8% took more than a month and, interestingly 2% did not came back. Further details can be found in [3] and [4].
Flooding is a good example of natural disasters where the information obtained from cell phone traces can be very useful, as usually severe flooding is caused by heavy storms that can be predicted and the models of evacuation of a specific area can be run in advance.
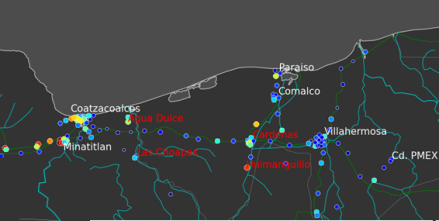
Figure 2. Affected aread during the floodings. Main cities and communication antennas.
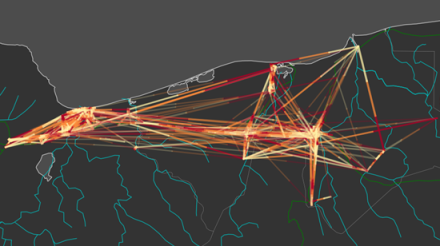
Figure 3. Evacuation routes of the affected areas during the flooding represented as flow between communications antennas.
Earthquakes affect large geographical areas that cause a major and immediate disruption to potentially large number of individuals that as a result, change their normal behavior and mobility. We focus our analysis on the social behavioral changes that took place during the 2012 Oaxaca earthquake in Mexico. The earthquake had a 7.4 magnitude and struck at 12:02 local time on Tuesday, 20 March 2012. Its duration was approximately between 40 and 300 seconds. Its epicenter was near the border between the states of Guerrero and Oaxaca and significant tremors were felt in areas up to several hundred kilometers away, including Mexico City, Acapulco and Veracruz. Two people were killed and over 30,000 houses were damaged or destroyed. Although the magnitude of the earthquake was considerable, damages on infrastructures were small due to the high standards of Mexican building regulation. As a result the cellular infrastructure was not damaged and communications happened during the earthquake.
We focused our study in a set of urban areas located at 100-200km from the earthquake epicenter and analyze the behavioral changes that took place in terms of communication (call volumes and call durations), social activity and mobility. Figure 4 presents the area affected, with the main urban areas (Oaxaca, Veracruz, Acapulco and Mexico DF), the epicenter of the earthquake and the activity of the towers during the earthquake. Further details of this study can be found in [5].
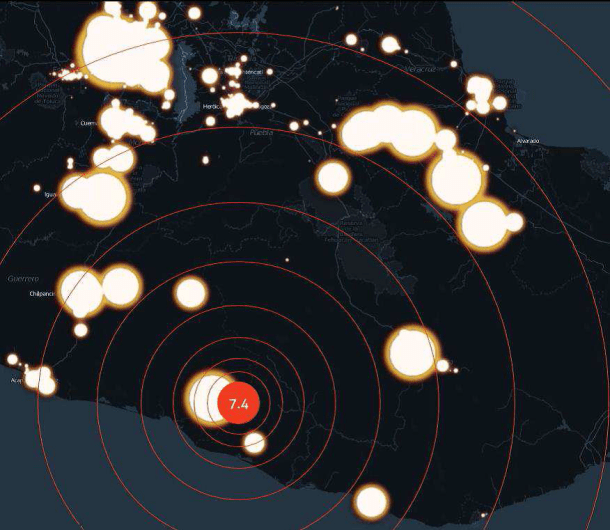
Figure 4: Call volume during earthquake. There is an increase in the number of calls during the earthquake, especially in heavily populated areas. The high intensity in the upper left corner represents Mexico DF.
Our results indicated that the social response in terms of call and duration volumes can be divided in three stages: (1) the first stage, from the earthquake up to five minutes after the earthquake, consists of one spike of high activity characterized by a large number of short calls; (2) the second stage, which lasts between one and two hours, is characterized by a reduced activity compared to the baseline and also short calls and (3) the last stage, that lasts around 5 hours, has a moderate increase in both call and duration volumes. These changes are observed across all affected cities, although the increase in volumes tends to be larger as the city gets closer to the epicenter of the earthquake. We also found a minor change in mobility whereas citizens appear to increase their mobility during the earthquake when compared to the baseline behavior.
The use of cell phone data has a lot of potential to study the mobility and behavior of population after the impact of an earthquake. As such, we can find in the literature other examples, Bengtsson et al. [6] used cell phone traces in Haiti to trace population movements on a post-earthquake scenario, and, similarly, the government of New Zealand used cell phone traces to characterize short-term population movements after the 2011 Christchurch earthquake [7].
In conclusion, big mobile data offers a unique source of information to characterize mobility and behavior of individuals during and after natural disasters that can help in allocating better resources and plan for more efficient relief efforts. The potential of using such information is not only as a platform to characterize and study human mobility on real-time but also to create and simulate different scenarios and policies, evaluate the more effective ones, and plan for them. Different global institutions such as United Nations (through the United Nations Global Pulse) and the World Bank are already convinced of the potential of these approaches and are pushing for international efforts to make possible such solutions.
REFERENCES
[1] “An Agent-Based Model of Epidemic Spread using Human Mobility and Social Network Information”, E. Frias-Martinez, G. Williamson, V. Frias-Martinez, The 3rd IEEE Int. Conf. on Social Computing (SocialCom 2011), Boston, MA, USA
[2] “Measuring the Impact of Epidemic Alerts on Human Mobility using Cell-Phone Network Data”, Vanessa Frias-Martinez, Alberto Rubio and Enrique Frias-Martinez,Pervasive Urban Applications -PURBA 2012, Newscastle, UK, 2012
[3] “Flooding through the lens of mobile phone activity”, D. Pastor, A. Morales, Y. Torres, J. Bauer, A. Wadhwa, C. Castro-Correa, A. Calderón-Mariscal, L. Romanoff , J. Lee, A. Rutherford, V. Frias-Martinez, N. Oliver, E. Frias-Martinez, M. Luengo-Oroz, IEEE Global Humanitarian Technology Conference
[4] “Studying Human Behavior through the Lens of Mobile Phones during Floods”, A.J. Morales, D. Pastor-Escuredo, Y. Torres, V. Frias-Martinez, E. Frias-Martinez, N. Oliver, A. Rutherford, T. Logar, R. Clausen-Nielsen, O. de Backer, M.A. Luengo-Oroz, NetMob 2015
[5] “Characterizing Social Response to Urban Earthquakes using Cell-Phone Network Data: The 2012 Oaxaca Earthquake”, B. Moumny, V. Frias-Martinez, E. Frias-Martinez, Pervasive Urban Applications -PURBA 2013, Zurich,Switzerland 2013.
[6] Bengtsson, L., Lu, X., Thorson, A., Garfield, R., and von Schreeb, J. Improved response to disasters and outbreaks by tracking population movements with mobile phone network data: a post-earthquake geospatial study in haiti. PLoS medicine 8, 8 (2011), e1001083.
[7] Statistics New Zealand. Using cellphone data to measure population movements experimental analysis following the 22 february 2011 Christchurch earthquake New Zeeland Goverment, ISBN 978-0-478-37759-0 (2012).
[8] “A customizable behavior model for temporal prediction of web user sequences”, E. Frías-Martínez, V. Karamcheti, WEBKDD 2002-Mining Web Data for Discovering Usage Patterns and Profiles. Springer Berlin Heidelberg, 2002. 66-85.